Tutorial
Now, let's do something weird. Something I never saw people doing
in ROS2 world.
Let's provide the actual tutorial for our program.
Waypoints
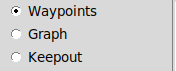
To work in this mode, select "Waypoints" radio button:
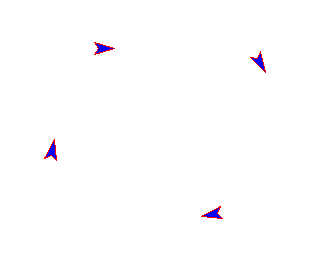
When you click on map (right panel) in this mode, the first click sets a waypoint (x,y,z). Then you can move the mouse around and then second click finalizes the waypoint (r,p,y):
Then you can click "Undo Last" or "Undo All" to undo your work.
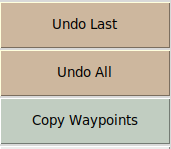
Finally, by clicking "Copy Waypoint", you can copy the Python code to the clipboard. Note that it is the same format we used in earlier sections, so you can directly paste it to your scripts:
Navigation Graph
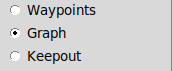
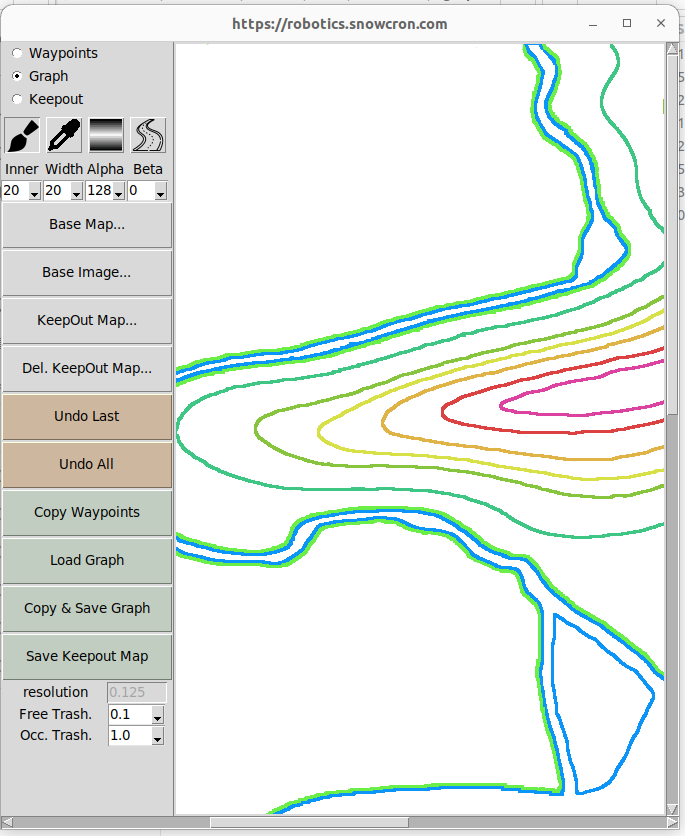
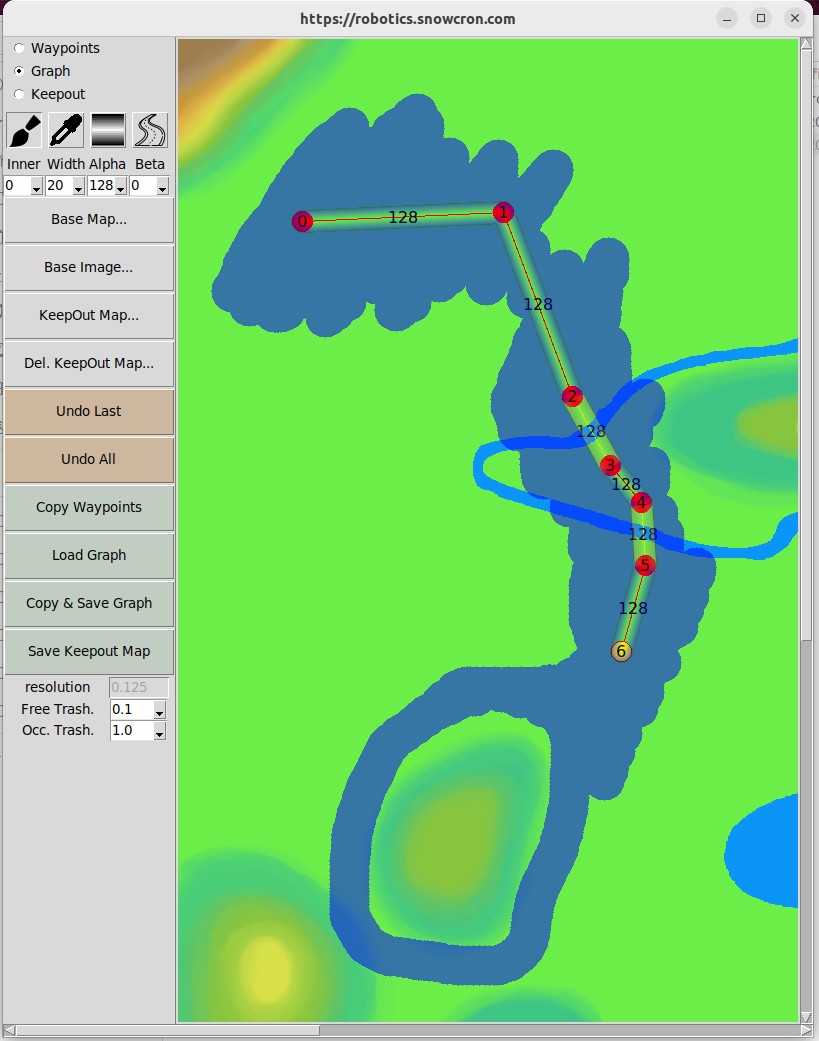
To work in this mode, select "Graph" radio button:
As war mentioned earlier, Navigation Graph is represented as an adjacency list. For each node, we list all nodes it is connected to. You can create it by clicking on the map:
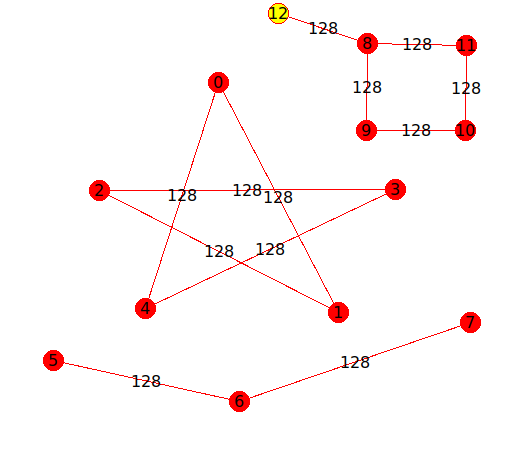
The second click on a selected vertex (node) of a graph breaks the "rubber line" from it to mouse pointer, allowing you to create isolated components of a graph.
Note that the last selected node is yellow, you can deselect it and then click another node to select it instead. Selected nodes are also used to draw keepout maps (see the "Keepout" below).
As expected, "Undo Last" and "Undo All" will remove last node or all nodes, accordingly.
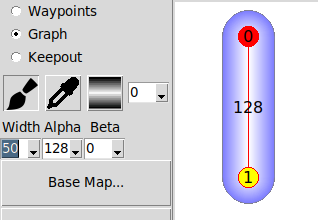
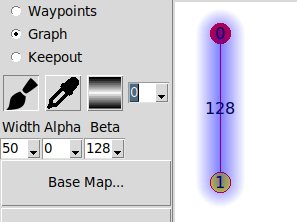
Note the number (default: 128) displayed on the edges of a graph. This is a thashold (the weight of a "road"), the concept similar to what you saw in the "Keepout Map" section. The higher the trashold, the more difficult is for us to move on this road.
In ROS2, 0 means "drivable" and 255 means "occupied" (unless we use "negate" flag, see below). In our case, I use scale 0-128, and then when we save the result, it is multiplied by 2. The reason is, I want the keepout mask to remain semi-transparent, so we can see the underlying map.
When Copy & Save Graph is clicked, the graph is copied to
clipboard. As I mentioned, it is copied in the format of an adjacency list,
which makes it easy to use in your Python code.
Additionally, it is saved to a .JSON file.
Note that a "real" adjacency list should contain a single list, while I use two: it is just a mater of convenience, the idea remains the same.
Maps
To load base map, select "Base Map..." button. Base maps are expected in a traditional ROS2 format: YAML file with description and PGM file it points to:
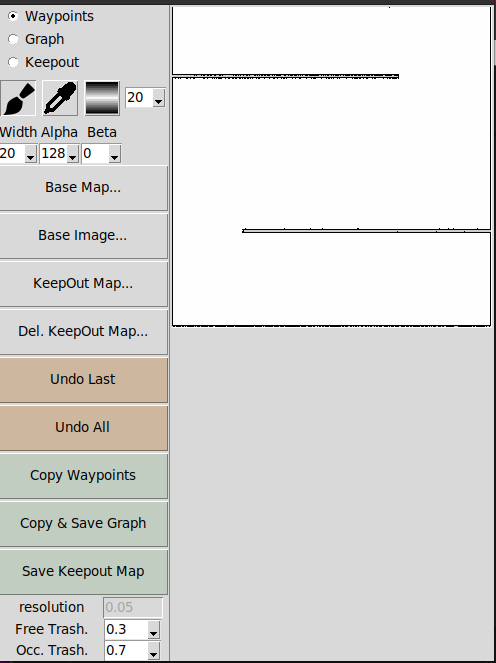
To load keepout map, select "Keepout Map..." button. Keepout maps are expected in a traditional ROS2 format: YAML file with description and PGM file it points to:
Load Base Image. The third option is not ROS2-standard, in other words, it is specific to my project. In earlier section, I provides a way we can show a dynamic image as a wallpaper on a ground, which allows us to show a nice looking map as well as do dynamic things, like drawing robot's trajectory.
To load base image, click "Base Image" putton. Expected is an RGB image file containing a "map". Note that it will be centered, currently, Utility doesn't provide means to custom shift it (no "origin").

Keepout
To work in this mode, select "Graph" radio button:
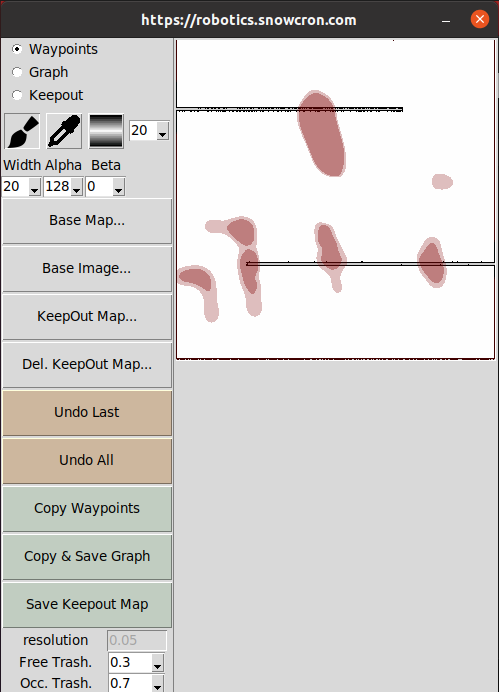
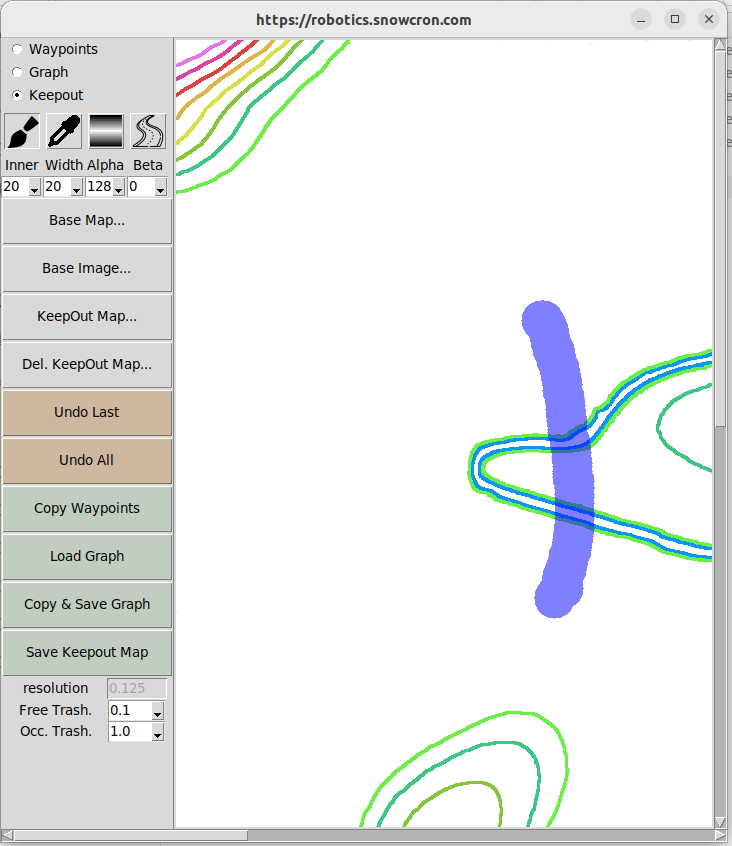
You can directly draw keepout zones on the map by using "brush" icon. You can set the size of the brush using "width" combo box, and transparency of the brush using "Alpha":


This button allows you to sample colors from the keepout map. The result is printed in the cout:
This button works together with Graphs. It takes the connected component of a graph that includes a selected node (in other words, you can select component of a graph), and draws keepout lines along its noges.
The width of such a keepout line is set by a combo box that is located next to a Gradient button.
Before I continue, let me explain why we would like to turn nice and easy to code adjucency lists of navigation graphs into "analog" keepout maps. First of all, we might need to draw a wall on a keepout map, and it is way easier to draw a line and turn it into a wall. Second, some algorithms require keepout maps, rather that the graph. For eaxmple, if your tractor has to plow a field. Or if your robot moves across a rugged terrain.
Note, when we draw "roads", we do not just want the dark line on a keepout map: a darw line is as a mated of fact a wall, an obstacle! We want a road to be transparent, and the closer we are to the side of a road, the higher should be the price to drive there, so that our robot stays within a road but can move sideways, within limits.
In the same time, we can not just create a gradient across the road, as it will mean that only one pixel wide line in the middle of the road is trully "transparent". So we need to draw a transparent road of certain width and AFTER this width, create gradient as we approach the ditches.
Here is what we do:
Gradient width combo box sets the width of a transparent area
(the road itself).
Width combo box sets the overall width of a road (road plus road sides).
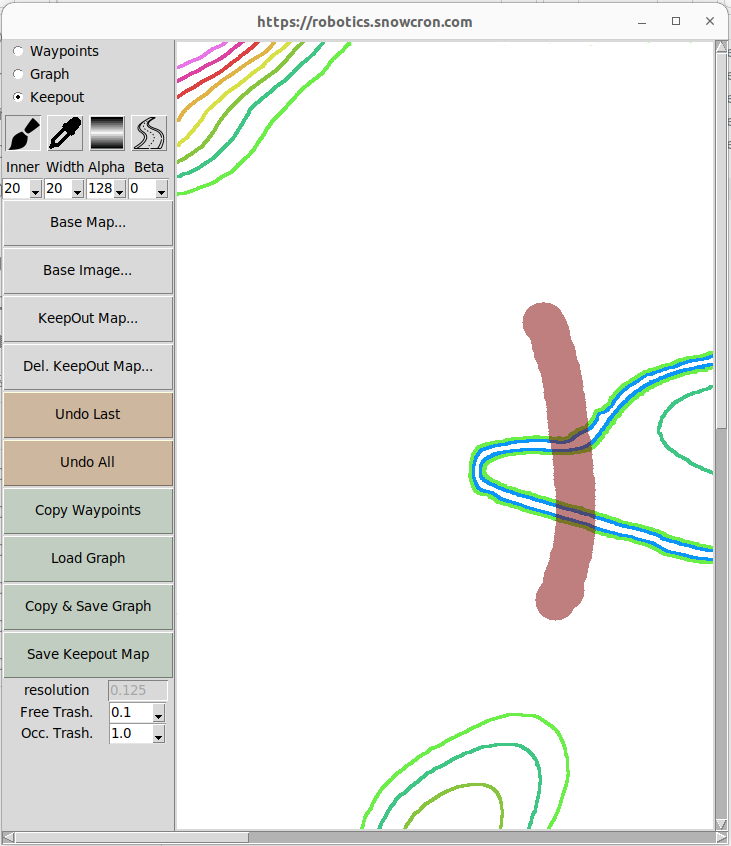
Note that if road width is more or equal to total width, road width will be
set to zero.
Gradient goes from Alpha to Beta. If Beta is set higher than Alpha,
instead of a road (transpatent center) we draw a wall (transparent
sides).

This part is error-prone, so please pay attention. When a keepout map is saved, the values from "Free Trash." and "Occ. Trash" are used. It means that you can draw with low transparency and it will be visible while you draw, but after you save and reload the map, it will not be shown, as it is less than trashold.
In this case, open YAML file you just saved abd correct values. 0.1 and 1.0 will usually do.
Creating map with roads
Let's create a map with some roads on it.
1. Load the base image
Click "Base Image" and select perfect_topo_color.png
This is a background texture, the fact that it has topo lines doesn't mean anything, you can use grass, hills... anything.
2. draw a keepout map.
Keepout map is a mask placed on top of a background image, drawn in shades of gray. The darker the shade of a particular area, the less desirable it is for routing algorithm to move the robot there. So we want roads to be white and ditches to be black.
Let's draw a short road across the hill. Click on "Keepout" radio button, select "brush" icon button (third icon from the left), set sizes and other parameters of the brush in the combo boxes below the brush icon, and draw something:
Let's save the result (Save Keepout Map button) and reload it, the color changed, but the rest is the same:
Using this functionality, we can fill large areas of a map, making it more or less preferable for robotic navigation.
Adding roads to keepout map
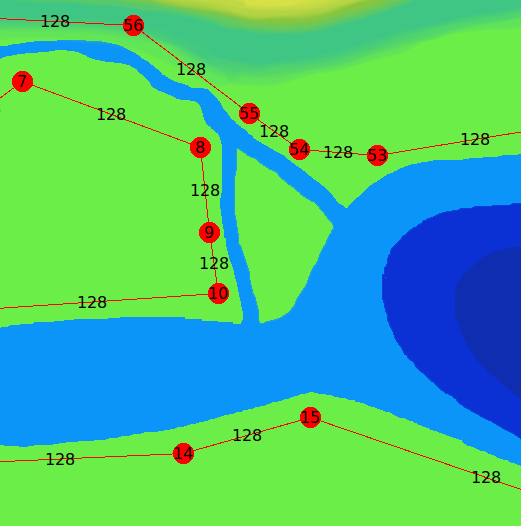
Now let's click "graph" radio button. We can now click on nodes of road graph (second click on the same node will mark the end of a sequence). Note that this time I used a "nice" base image and it has river. Should we move the robot across? Probably not. To continue road across the river, use "bridge" icon. Note that the road turns color from red to yellow when in bridge mode.
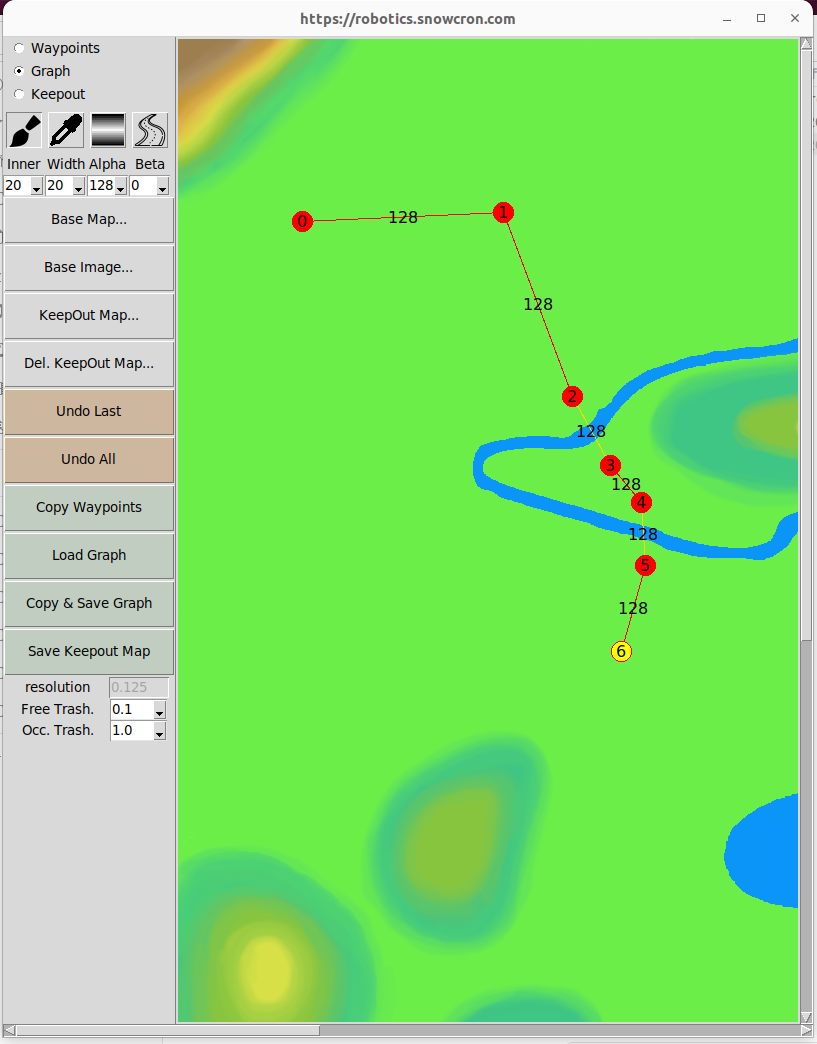
Now we can save our road network and copy it in a clipboard in the same time (Copy & Save Graph). This network can later be used by routing software or by my other utility, topo_to_3d.py. Also you can avoid (or partially avoid) using road graph by turning roads into keepout map. For that we need to make sure roads are white (maximum driving permission), while ditches are darker. And yes, before drawing roads, you can use "Keepout" functionality to paint the entire map. This way robot can drive anywhere, but roads are prefered.
Note that (it will be changed in future) you can not start roads too close to map's edges and placing nodes Too close to each other can also create problems.
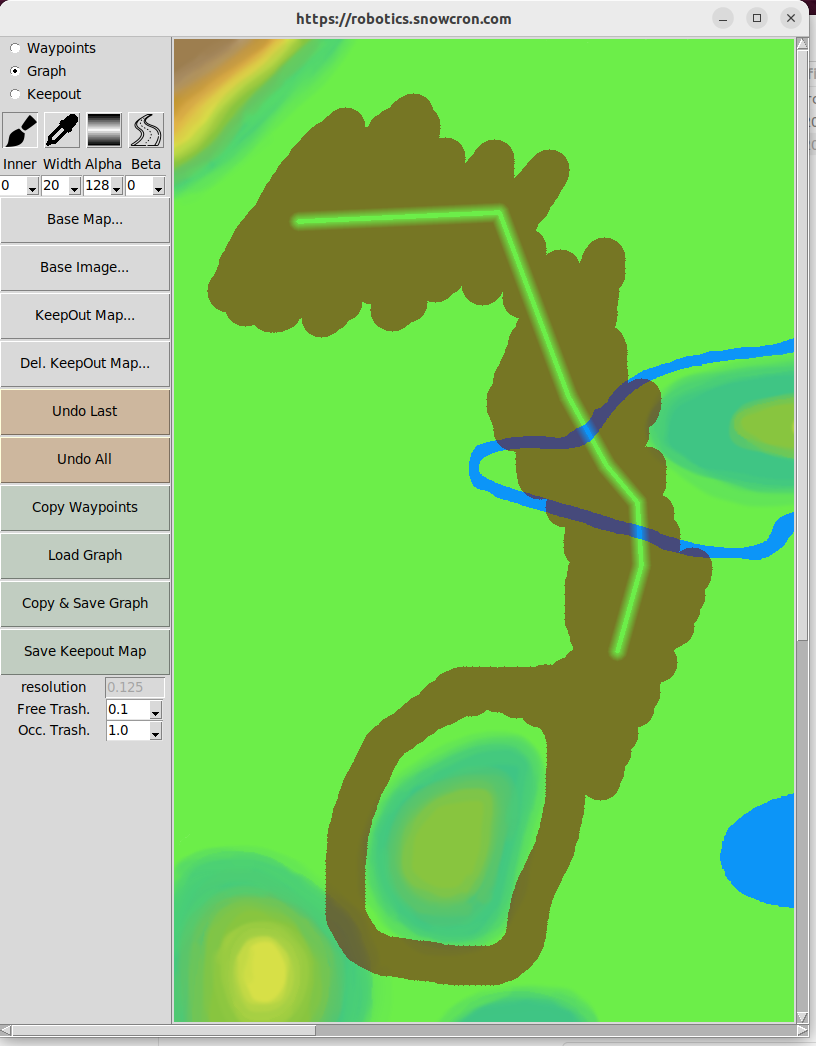
So draw some kepout map and then click "gradient" button to turn roads into part of keepout map:
Note that middle of the road is more transparent while side of the road fades into the firls around it.
You can save this keepout map and reload it:
Finally, you can create a complete road graph and save it.
Note that saving roads as part of keepout map is a good idea if you want to be able to run "pure" keepout based algorithms. If you use road graph, it is not required. But what if you want to use both? In such case you probably should use keepout map to find a way to the closest road, and then use roads.